
BANKING & INSURANCE
A regulated framework
Permanent and internal control, three lines of defence, operational resilience. The obligation is explicit and the supervisor asks for the proof.
Who asks: the supervisor, internal audit, the risk committee.
xGRC · sector-independent
Most risk tools are screens drawn for one industry: a banking incident form, an insurance audit grid, an industrial inspection register. Each encodes a trade in its very structure.
Changing trade then means changing tool — or bending the one you have until it fits.
What we ship
e-Beyonder ships processes — yours, from the inventory through to execution — and the risk framework attaches to them at the task. The vocabulary, the rules, the actors, the data: all of that comes from you.
Those processes are described in full, not merely listed: events, tasks and their work instructions, business roles, human and technical resources, business rules, input and output variables. That depth is not a modelling exercise for its own sake — it is what lets risk and control sit at the task rather than at the process.
The diagram and the structured description are not two things to keep in step: there is only one set of data. The drawing is not a file sitting somewhere beside the tables — it is a way of looking at that data, exactly as a table is. Drawing a task in the graphical model writes the data; entering the data redraws the diagram. So there is never a diagram to bring back up to date afterwards: the question does not arise.
And it is from that model that the procedures are written. A procedure is no longer a document you write and then let age: it is produced from the process, so it is correct for as long as the process is.
What holds for a claims settlement holds for a machining operation or for allocating a home, because the mechanics bear not on what the work is about but on how it is structured: a task, a resource, a rule, a failure point, a control.
This is a consequence of architecture, not a commercial ambition. A tool built on process travels across industries; a tool built on a trade cannot.
ONE STRUCTURE, THREE TRADES — AND YOURS
Three examples, taken as far apart as we could find them. Each row gives what it is first, then the three illustrations — the definition is what matters, not the vocabulary of the examples.
TASK an act of work that someone performs
Approving a payout · checking a dimension after machining · allocating a home
RULE what that act has to respect
A signing delegation by amount · a tolerance set by the drawing · a priority scale
FAILURE what happens when the rule is not held
A threshold passed unsigned · an out-of-tolerance part shipped · an allocation off the scale
DATA the trace that act leaves in your systems
A settlement line · a measurement record for the part · an application file
CONTROL the same mechanism, in all three cases
Your trade fills the first four rows in its own words. That is all we need to know about it.
What "described in full" means
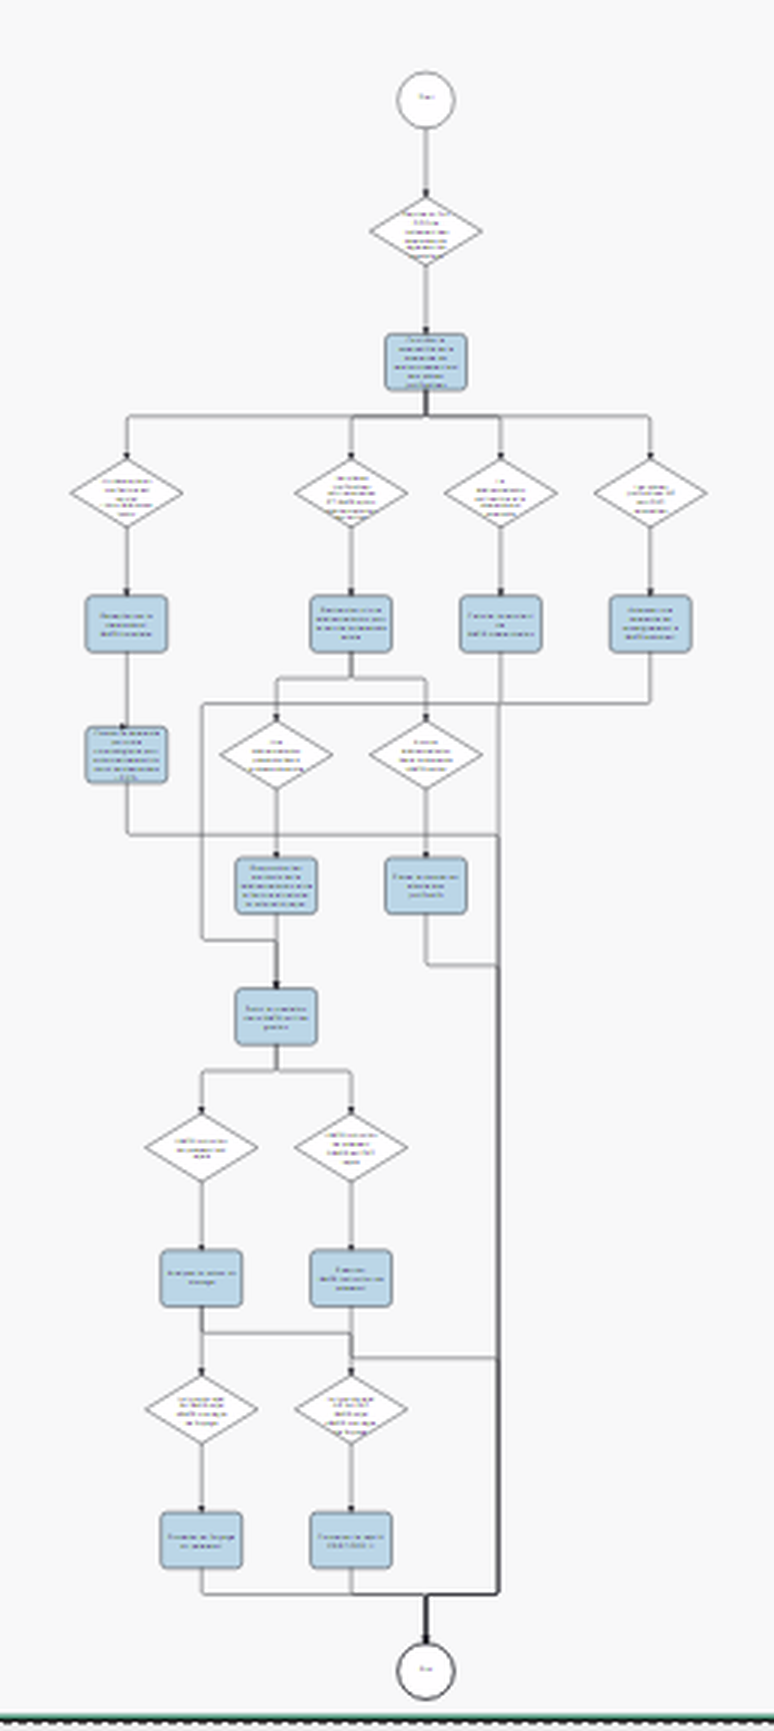
Alongside is a client's live business process — calculating and settling health benefits — shown at 29% so it fits whole in the frame. You cannot read the labels, and that is deliberate: what is on display here is not its content but its size.
Some thirty tasks, as many conditions, branches that rejoin. Each of those tasks carries its resources, its rules and its work instructions; those are the tasks where risks sit and where controls execute.
That is the difference between modelling a process and listing it. A list would have fitted on one line.
Three reasons to control
What pushes an organisation to master its processes is not the same from one industry to the next. In one case it is a regulator, in another a customer, in a third a public-service duty. But the question put to them is always the same one: prove it.
The three industries below are examples, chosen because they are far apart. Yours does not need to be on that list for the mechanics to apply: it only needs to have processes, and someone to account to for them.
BANKING & INSURANCE
Permanent and internal control, three lines of defence, operational resilience. The obligation is explicit and the supervisor asks for the proof.
Who asks: the supervisor, internal audit, the risk committee.
MANUFACTURING
In nuclear or aerospace subcontracting, the customer imposes its process discipline and comes to verify it. Control is not a legal obligation — it is a condition of market access.
Who asks: the customer, its auditor, its specification.
SOCIAL HOUSING
Safety of property and people, fairness in allocations, continuity of the service provided. Tightly framed processes, carried by dispersed teams.
Who asks: the supervising body, the elected official, the resident.
One detail that matters in the third column: dispersed teams, with no fixed desk and no office hours, do not fill in a central form. They receive a task wherever they are. That is an execution constraint, not a documentation one — and it is exactly what the executable approach addresses.
The reason
If the platform travels across industries, it is because it is built on process rather than on a trade. That is also what makes it Lean — not by badge, but by construction.
We do not claim a methodology. We produce its effects, and they can be checked on screen. The five points below are properties of the product, each verifiable in a demonstration.
Information is entered once and reused wherever it serves. Data to be controlled is not replicated: it is imported.
Control runs continuously. There is no campaign to relaunch, so there is no quarterly workload peak to absorb.
The task reaches whoever must handle it, when it is available. No central hand-off point, therefore no organisational bottleneck.
A control's effectiveness is computed from its execution; it is not estimated in a meeting. A computed figure is argued differently from a judgement.
Remediation points back to the step that was missed and trains the operator along the way. No improvement programme run alongside the work.
A label is displayed. A design is observed. We prefer the second kind of proof, because it holds up in front of a practitioner.
We model it in your vocabulary, place a risk on it and execute its control. If the structure does not hold, you will see it immediately — and so will we.